

As CECP celebrates its 25 years of purpose throughout 2024, it is important to acknowledge the crucial role that our research and benchmarking have played in the organization becoming a leader in, and developing the standards for, the corporate purpose and societal investment space. This year is a great opportunity to look back at how the data has changed (and how it has stayed the same!) since the inception of Giving in Numbers™, the largest and most historical data set on corporate social investment trends, in partnership with more than 617 multibillion-dollar companies.
While Giving in Numbers did not start in 1999, the year of CECP’s founding, top companies were invited to participate in the survey three years later, collecting data on their corporate “giving” in 2001. CECP has redefined corporate social investments as Total Community Investment (TCI), the sum of a company’s direct cash, foundation cash, and non-cash. At that time, 17 companies participated in the survey. These companies had a median revenue in 2001 of US$19.4B (US$32.6B adjusted for inflation) and reported:
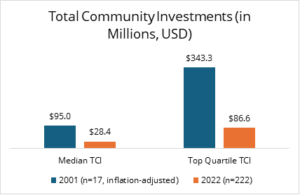
- Median TCI of US$56.6M (US$95.0M adjusted for inflation)
- Top Quartile TCI of US$204.4M (US$343.3M adjusted for inflation)
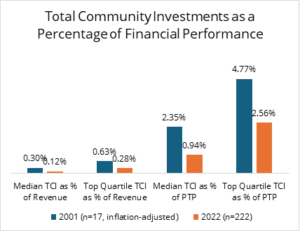
- Median TCI as a Percentage of Revenue of 0.30% and Top Quartile TCI as a Percentage of Revenue of 0.63%
- Median TCI as a Percentage of Pre-Tax Profit of 2.35% and Top Quartile TCI as a Percentage of Pre-Tax Profit of 4.77%
Since that time, the survey has expanded to include data from a much larger number of companies, with 222 participating in last year’s survey, which collected 2022 data. These companies had a median revenue of US$20.7B and reported:
- Median TCI of US$28.4M
- Top Quartile TCI of US$86.6M
- Median TCI as a Percentage of Revenue of 0.12% and Top Quartile TCI as a Percentage of Revenue of 0.28%
- Median TCI as a Percentage of Pre-Tax Profit of 0.94% and Top Quartile TCI as a Percentage of Pre-Tax Profit of 2.56%
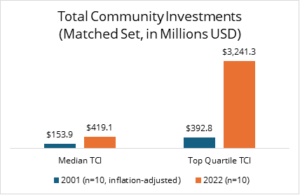
What is most interesting, however, is that 10 of the original 17 participating companies reported their 2022 data, a testament to the benchmarking information accessible to affiliated companies. The median revenue in 2022 for those 10 companies was US$56.0B (up from US$40.4B in 2001) and they reported:
- Median TCI of US$419.1M
- Top Quartile TCI of US$3.2B
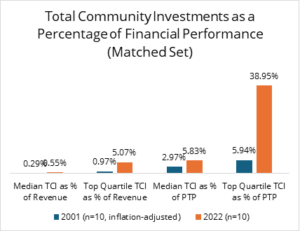
- Median TCI as a Percentage of Revenue of 0.55% and Top Quartile TCI as a Percentage of Revenue of 5.07%
- Median TCI as a Percentage of Pre-Tax Profit of 5.83% and Top Quartile TCI as a Percentage of Pre-Tax Profit of 38.95%
These steadfast companies are juggernauts, both in their financial performance and in their dedication to societal investment, showing how seamlessly the two go hand in hand.
Of course, societal investment does not happen in a vacuum. During many national and global crises since the inception of Giving in Numbers, society has called on corporations to respond. For example, 2001 was an exceptional year due to the September 11th attacks. This was reflected in a 33% decline in median TCI the following year, as community investment commitments ended (unmatched set, inflation-adjusted). 2008 saw a significant 7% increase during the height of the global financial crisis, when communities needed more support than ever to meet their basic needs. There was also a 13% increase in 2020 from the previous year, demonstrating how quickly companies responded to a call to action for giving during the start of COVID-19. Though, similar to the decline following September 11th, there was a 12% decrease from 2020 to 2021, when COVID-19 relief provided by companies decreased.
Through it all, CECP has collected this data through Giving in Numbers; we are helping the field to better understand these trends and allowing companies to benchmark themselves against their peers. The survey has grown to include measuring employee engagement, operations, and corporate purpose. The annual report remains the unrivaled leader on corporate societal investments.
Please reach out to CECP Insights to further explore our historical dataset, and stay tuned for the latest edition of Giving in Numbers which will be published this fall.