
It’s the most wonderful time of the year, and no, we don’t mean the holidays! We mean the release of the annual Giving in Numbers infographic, which offers the public the very first look at the latest trends that are defining the strategies behind corporate social investments in 2018. (You can download your own copy here!) CECP’s Giving in Numbers is the unrivaled leader in benchmarking on corporate social investments, in partnership with companies. The data are embraced by professionals across all sectors globally to understand how corporations invest in society, with topics ranging from cash and in-kind/product, employee volunteerism and giving, and impact measurement.
At the 2019 CECP Summit in May, my colleague and Senior Director of Data Insights at CECP, Carmen Perez and I presented our initial analysis of the data, and we’ll continue to derive insight from the rich repository of data throughout the summer. While the full report will be released publicly on October 17 (October 16 for companies affiliated with CECP), below we’ve highlighted some of the top-level findings on 2018 corporate contributions from the 2019 Giving in Numbers survey.
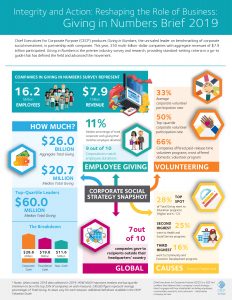
• Community investments remain strong and continue growing: Aggregate total giving in 2018 was $26 billion dollars, an increase of 11% (2018 vs. 2016). Also, six out of ten companies increased total giving by at least 2% in the last three years.
• Employee engagement sustained: The average participation rate of employees volunteering at least one hour on-company time increased from 33% to 34% between 2018 and 2016 in a matched-set of companies.
• Volunteer programs that allow service flexibility and easier access to employees rose: Offering of flexible schedule and paid-release time increased from 81% to 85% between 2016 and 2018. In fact, Paid-Release Time was the most offered volunteer program in 2018, with 66% of companies offering it. Paid-Release Time continues to be an excellent opportunity for companies to demonstrate to their employees that giving back in the community is a value that the company wants to reward and in turn, employees sign up with gusto. (Popularity of various volunteer programs to come in the final Giving in Numbers report.)
• Cash vs. Non-Cash structure remains stable: The distribution of Cash vs. Non-Cash, in a matched set of companies that have provided giving data in each of the last three years, has remained steady. Non-cash represents 19% of total contributions in 2016 and 2018; most contributions come in the form of cash–81% of all contributions.
• Healthcare industry leads giving growth: With 69% of health care companies expanding giving, the health care industry accounted for two thirds of the aggregate increase in giving between 2016 and 2018 across the board. Some of the most common reasons for such increase in contributions are related to the increase of product donations for patient support programs, assistance funds, product donations for disaster relief among global programs, and product donations in response to the opioid crisis, among others.
CECP is inspired to see that giving, employee engagement, and volunteerism continue to steadily grow, which comes as no surprise given how readily companies are stepping up to fill the unmet needs of communities around the world.
Please check out the latest Giving in Numbers infographic and email us at info@cecp.co to tell us about your favorite initial finding or any topic you’d be interested to see in the final Giving in Numbers: 2019 Edition report to be released in October.